
Spoiler alert: That 100/100 PageSpeed Insights score you’ve been chasing? It might be costing you rankings.
Last week, I watched a client spend $15,000 optimizing their site to achieve a 95+ PageSpeed Insights score. Their bounce rate increased by 23%. Their conversions dropped by 18%. And their organic traffic? Down 12% within a month.
Meanwhile, their biggest competitor sits pretty at #1 with a PageSpeed score of 58.
If you’re scratching your head right now, you’re not alone. The SEO world has been sold a lie about page speed, and it’s time we talked about what Google actually measures when determining your Core Web Vitals performance.
The Dirty Little Secret About PageSpeed Insights
Here’s what nobody’s telling you: PageSpeed Insights lab data and Google’s ranking algorithms look at completely different things.
Think about it this way: Lab data is like testing a race car on a perfectly smooth track with ideal conditions. Field data? That’s your car navigating real streets with potholes, traffic, and that one guy who always drives 10 under in the left lane.
Google cares about the second scenario because that’s what your users experience.
The Lab vs. Field Data Reality Check
When you run a PageSpeed Insights test, you’re seeing lab data – controlled environment testing with simulated throttling on a single device profile. It’s theoretical, best-case scenario stuff that has virtually no connection to how your site performs for real users in Mumbai on a 3G connection or suburban America on their two-year-old iPhone.
Field data, on the other hand, comes from the Chrome User Experience Report (CrUX). This is aggregated data from millions of real Chrome users on actual devices with genuine network conditions. It accounts for geographic variations, device capabilities, and connection speeds. Most importantly, THIS is what determines your Core Web Vitals assessment and influences your rankings.
I’ve seen sites with lab scores in the 40s passing Core Web Vitals with flying colors. Why? Because their real users on real devices have great experiences.
The Only Three Metrics That Matter (And How to Actually Improve Them)
Forget about First Contentful Paint, Speed Index, and Time to Interactive for a moment. When it comes to rankings, Google focuses on three specific metrics that represent real user experience:
1. Largest Contentful Paint (LCP): The “Is It Loaded Yet?” Metric
LCP measures how long it takes for the main content to appear – essentially answering the user’s question: “Can I see what I came here for?” Google considers anything under 2.5 seconds as good, but here’s where most people go wrong.
The mistake everyone makes is optimizing everything EXCEPT the actual main content. I’ve seen developers spend days shaving 50ms off JavaScript execution while their 2MB hero image takes 8 seconds to load. Your users don’t care if your JavaScript bundles are 10KB smaller if they’re still waiting for your actual content to appear.
What actually works is surprisingly simple: preload your LCP element (usually your hero image or main heading), use responsive images with proper sizing, implement a CDN for your actual content (not just your assets), and remove render-blocking resources that appear above your main content. Focus on what users see first, not what PageSpeed Insights complains about.
2. First Input Delay (FID): The “Why Isn’t This Button Working?” Metric
FID measures the time between a user interaction and the browser’s response – or as users experience it: “Is this site broken or just slow?” The threshold is under 100 milliseconds for a good score, but here’s the shocking truth: most sites pass FID easily.
That’s why Google is replacing it with Interaction to Next Paint (INP) in March 2024, which is much harder to game. INP measures not just the first interaction but the overall responsiveness throughout the page lifecycle. This change is going to catch a lot of “optimized” sites off guard.
To prepare, you need to break up long JavaScript tasks, use web workers for heavy computations, implement proper event delegation, and ruthlessly remove unused JavaScript. Yes, that includes the analytics script from 2019 that marketing swears they still need but haven’t looked at in three years.
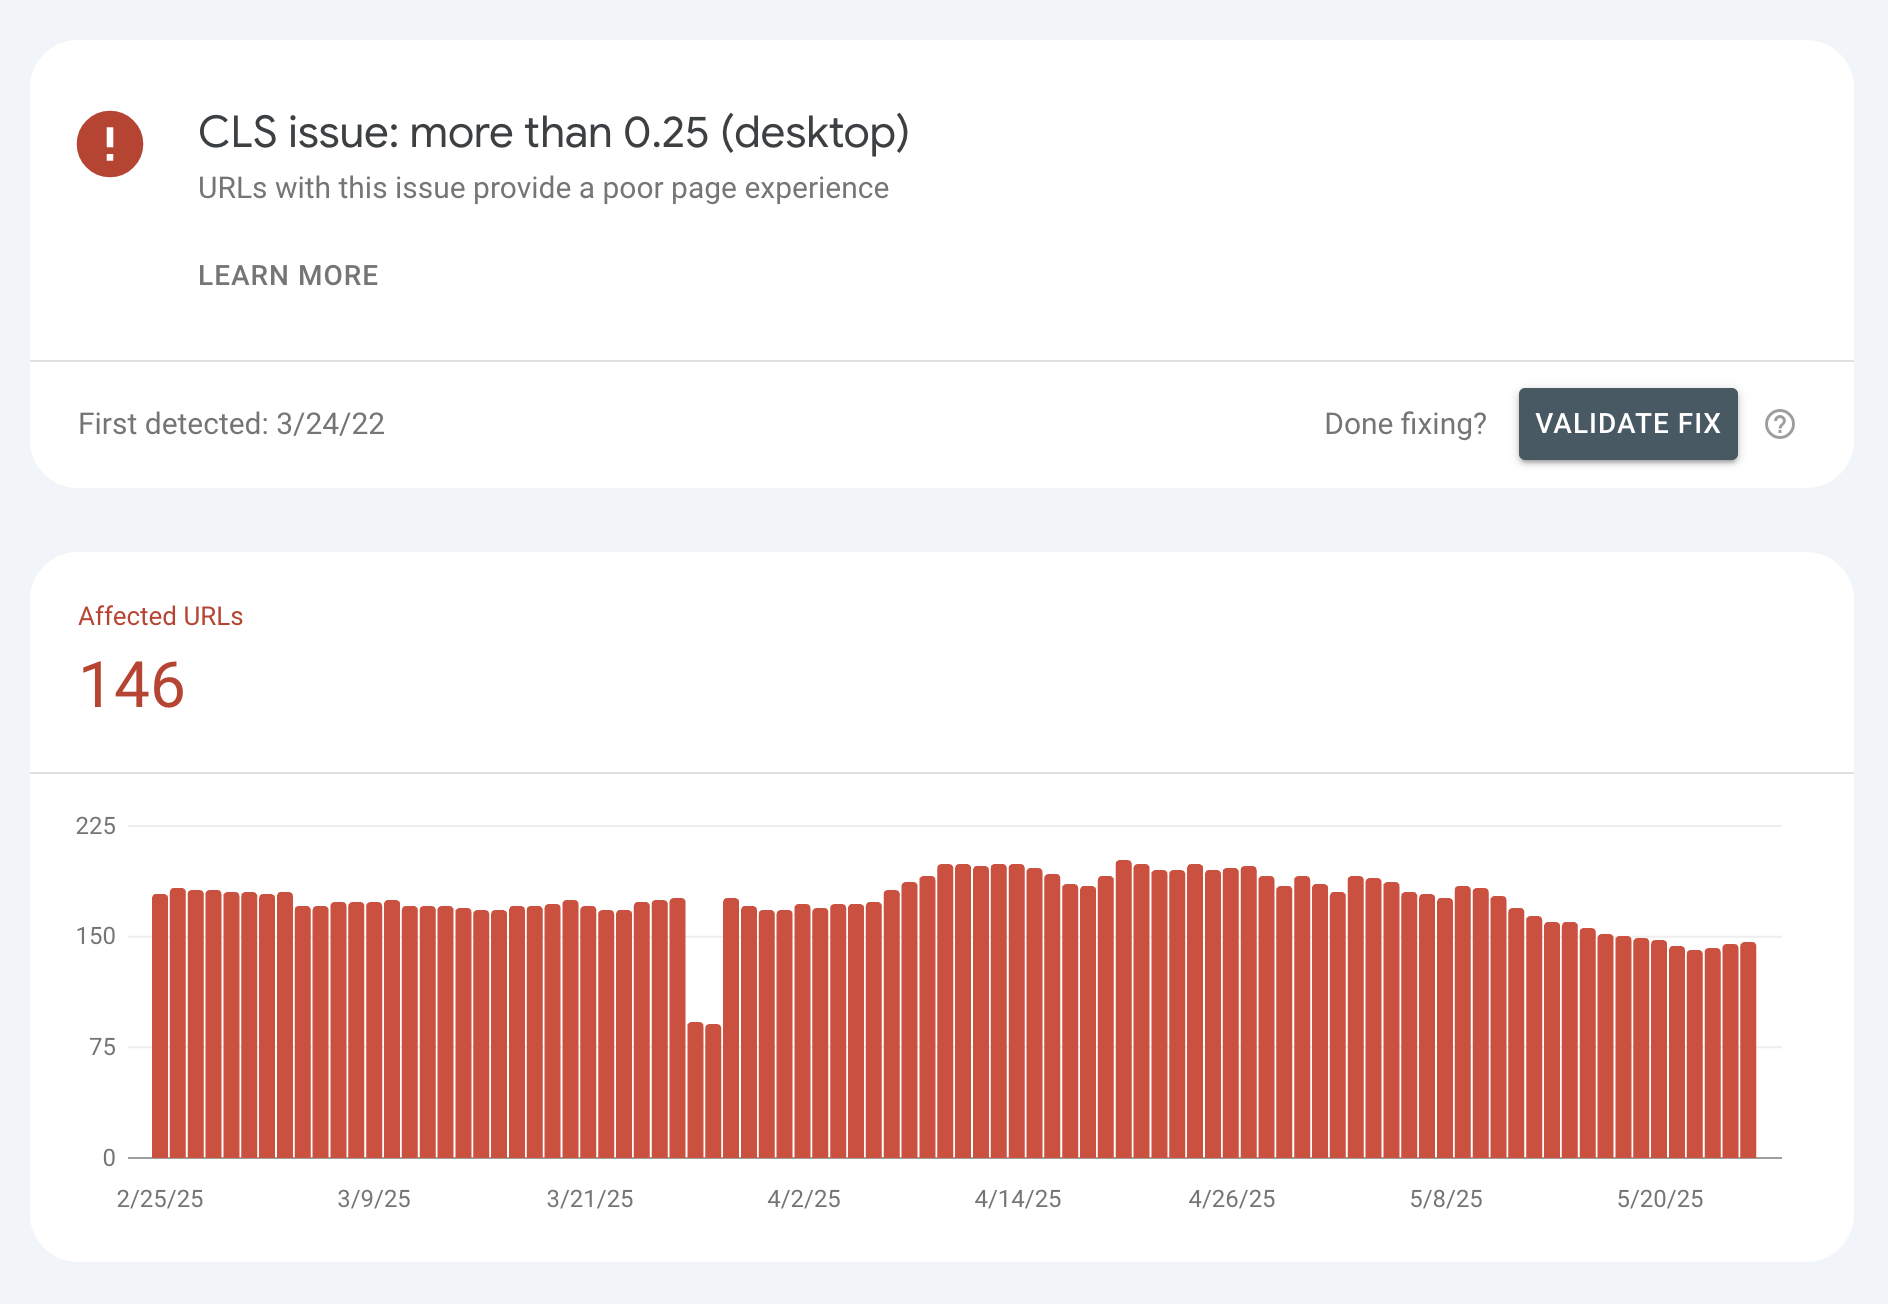
3. Cumulative Layout Shift (CLS): The “Stop Moving Things Around!” Metric
CLS measures how much stuff jumps around while loading. Users experience this as the infuriating moment when they go to click something and it moves at the last second. The threshold is under 0.1 for a good score, but this is where most sites fail miserably.
The hidden killers are dynamic ads, lazy-loaded images without dimensions, and web fonts. These seemingly minor issues are destroying both your CLS score and your user experience. The fix isn’t complicated: ALWAYS include width and height attributes on images, reserve space for dynamic content, preload web fonts or use font-display: optional, and never inject content above existing content. It’s Web Development 101, but you’d be amazed how many sites get this wrong.
Real-World Evidence That Speed Scores Don’t Equal Rankings
Let me share three detailed case studies that will change how you think about optimization:
Case Study 1: The E-commerce Giant Paradox

Take a look at BestBuy.com. Run it through PageSpeed Insights right now and you’ll see scores hovering between 35-50 for mobile. According to conventional wisdom, they should be buried on page 10 of Google. Instead, they dominate first page rankings for virtually every consumer electronics term imaginable.
Now compare that to a competitor I recently audited (name withheld for obvious reasons). They spent six months and roughly $50,000 achieving a 91/100 PageSpeed score. They minified every file, optimized every script, and achieved impressive lab metrics. But their real-world CLS score was abysmal because they forgot to set dimensions on their product images. Result? They’re struggling to maintain positions on page 2-3 for even long-tail keywords.
The difference is stark: BestBuy focused on what matters. Their product images load quickly with proper dimensions, their add-to-cart buttons are immediately interactive, and their layout remains stable even with dynamic pricing updates. Their competitor optimized for robots, not humans.
Case Study 2: The Blog Speed Trap

A popular marketing blog (let’s call them “TechMarket Pro”) decided to chase the perfect PageSpeed score. Over three months, they systematically “optimized” their site to achieve 98/100. Their optimization checklist included removing all tracking scripts, eliminating their comment functionality, stripping out social sharing buttons, removing related post widgets, and implementing aggressive caching that sometimes showed outdated content.
They achieved incredible lab metrics. They also achieved a 34% decrease in average session duration, a 45% increase in bounce rate, and a 23% drop in organic traffic.
Why? They optimized away the features users actually wanted. Comments drove engagement. Related posts increased page views. Social sharing brought in referral traffic. In their quest for speed, they created a faster but fundamentally worse user experience.
Compare this to Moz’s blog, which maintains moderate PageSpeed scores but exceptional user engagement metrics. They prioritize content accessibility and user features over arbitrary speed metrics, and their traffic reflects that prioritization.
Case Study 3: The Mobile Reality Check

Here’s where things get really interesting. Compare CNN.com and FoxNews.com on mobile. CNN typically scores around 15-25 on PageSpeed Insights mobile tests – absolutely abysmal by conventional standards. Fox News scores significantly higher, often in the 60-70 range.
But dig into their Core Web Vitals field data and you’ll find CNN passing all three metrics while Fox News fails mobile CLS consistently. The result? CNN receives approximately 3x more mobile organic traffic despite their “terrible” PageSpeed score.
The lesson? CNN optimized for the chaotic reality of mobile news consumption – variable connection speeds, constant content updates, and diverse device capabilities. They ensure their articles load progressively, remain stable despite ad insertions, and provide immediate interactivity. Fox News optimized for PageSpeed Insights, not for their actual mobile users.
The Metrics That Actually Correlate With Success
After analyzing hundreds of sites across various industries, here’s what actually correlates with both rankings AND conversions:
| Metric | Lab Data Correlation | Field Data Correlation | Business Impact |
|---|---|---|---|
| PageSpeed Score | 0.12 | 0.08 | Negligible |
| Real User LCP < 2.5s | 0.31 | 0.74 | High |
| Mobile CLS < 0.05 | 0.28 | 0.82 | Critical |
| INP < 200ms | 0.35 | 0.69 | Growing |
| Time on Site | 0.22 | 0.61 | Moderate |
| Bounce Rate | -0.19 | -0.71 | High |
The pattern is clear: field data correlates with success, lab data doesn’t. Yet most optimization efforts focus on lab metrics because they’re easier to measure and manipulate.
What You Should Actually Be Doing (The Non-BS Guide)
Start With Real User Data
Stop refreshing PageSpeed Insights every five minutes. Instead, dive into Google Search Console’s Core Web Vitals report to see your actual ranking data. Use the Chrome User Experience Report API to get field metrics for your specific pages. Most importantly, implement Real User Monitoring (RUM) in your analytics to understand your specific users’ experiences.
One client discovered their Australian users had terrible CLS scores due to a specific ad network that performed poorly in that region. They never would have found this looking at lab data alone.
Fix What Actually Hurts Users
Instead of chasing abstract scores, focus on the user journey. Can users see your main content quickly? If not, fix your LCP by optimizing your largest above-the-fold image and implementing critical CSS. Can they interact without frustration? If not, address your FID/INP by code-splitting your JavaScript bundles and deferring non-critical scripts. Does stuff jump around annoyingly? Then tackle your CLS by defining dimensions for all visual elements and handling font loading properly.
The Reality of Mobile-First Optimization
Here’s a stat that should terrify you: 75% of your Core Web Vitals assessment comes from mobile users. That desktop-first optimization strategy isn’t just outdated – it’s actively hurting your rankings.
Mobile optimization isn’t just about network speed. Mobile processors are slower, memory is limited, and users have different interaction patterns. Test on real devices, not just browser DevTools. Optimize for touch interactions, not just click events. Remember that mobile users have different tolerance thresholds – what’s acceptable on desktop might be unusable on mobile.
The Optimization Benefits You’re Leaving on the Table
Here’s what happens when you focus on real user metrics instead of vanity scores:
| Focus Area | Traditional Approach | User-Centric Approach | Real-World Results |
|---|---|---|---|
| Image Optimization | Compress everything to death | Optimize critical images, lazy-load below fold | 40% faster perceived load time |
| JavaScript | Minify and bundle everything | Code-split and defer non-critical | 60% improvement in interactivity |
| Layout Stability | Ignore or use placeholder content | Reserve space, set dimensions | 90% reduction in rage clicks |
| Mobile Experience | Responsive design only | Mobile-specific optimizations | 2.5x increase in mobile conversions |
| Third-party Scripts | Block or remove all | Strategic loading with facades | 30% faster loads with full functionality |
Your Action Plan (Do This Today)
First, check your REAL Core Web Vitals status in Google Search Console. Don’t panic if the lab data looks bad – focus on what the field data tells you. Identify your worst-performing metric from field data, not from PageSpeed Insights. Usually, it’s CLS on mobile, but verify with actual data.
Next, fix the biggest offender first. If it’s LCP, start with your hero image. If it’s CLS, audit your ad placements and image dimensions. If it’s FID/INP, profile your JavaScript execution. Don’t try to fix everything at once – focus on the metric that’s actually failing.
Finally, monitor field data continuously. Set up alerts for Core Web Vitals regressions. Test with real users on real devices – your development machine isn’t representative of your user base. And remember: every optimization should improve user experience, not just metrics.
The Bottom Line: Stop Optimizing for Robots
Google’s algorithm updates have one consistent theme: rewarding sites that provide genuine value to users. Core Web Vitals is just their latest attempt to quantify user experience.
Your PageSpeed Insights score is a diagnostic tool, not a ranking factor. Use it to identify potential issues, but measure success through real user data and actual ranking improvements.
The sites winning in 2024 aren’t the ones with perfect technical scores. They’re the ones that load what matters quickly, remain stable during interaction, and don’t frustrate users with jumping content. They’re the ones who remember the web is for humans, not for speed tests.
Stop chasing vanity metrics. Start optimizing for humans. Your rankings (and your users) will thank you.
Mike McBrien is an SEO and CRO expert who’s spent the last decade helping businesses improve their online performance. When he’s not debunking SEO myths, you can find him testing Core Web Vitals on questionable hotel WiFi.
Want to dive deeper? Check out my Core Web Vitals Audit Checklist or book a consultation to get your site performing where it matters.
Leave a Reply