
When Lightning-Fast Load Times Led to Plummeting Conversion Rates
Picture this: You’ve just spent months optimizing your video infrastructure. Your pages load in under a second. Based on performance, you are using the best video player. Your Core Web Vitals are green across the board. You’re celebrating with the team when the monthly conversion report arrives—and your stomach drops. Conversions are down 23%.
This is exactly what happened to us, and it kicked off one of the most revealing conversion rate optimization (CRO) studies we’ve ever conducted. What we discovered challenged everything we thought we knew about video performance and ultimately led to a fascinating turn of events with one of our vendors.
The Quest for the Perfect Video Player
Our company’s success hinges on video. VSL (Video Sales Letter) content drives our entire funnel—these carefully crafted sales videos are the primary way we communicate value and convert visitors into customers. After two years with Vidalytics, when engagement metrics started declining, we assumed our video infrastructure needed a performance overhaul. After all, every CRO guide preaches the gospel of speed: faster pages equal better conversions, right?
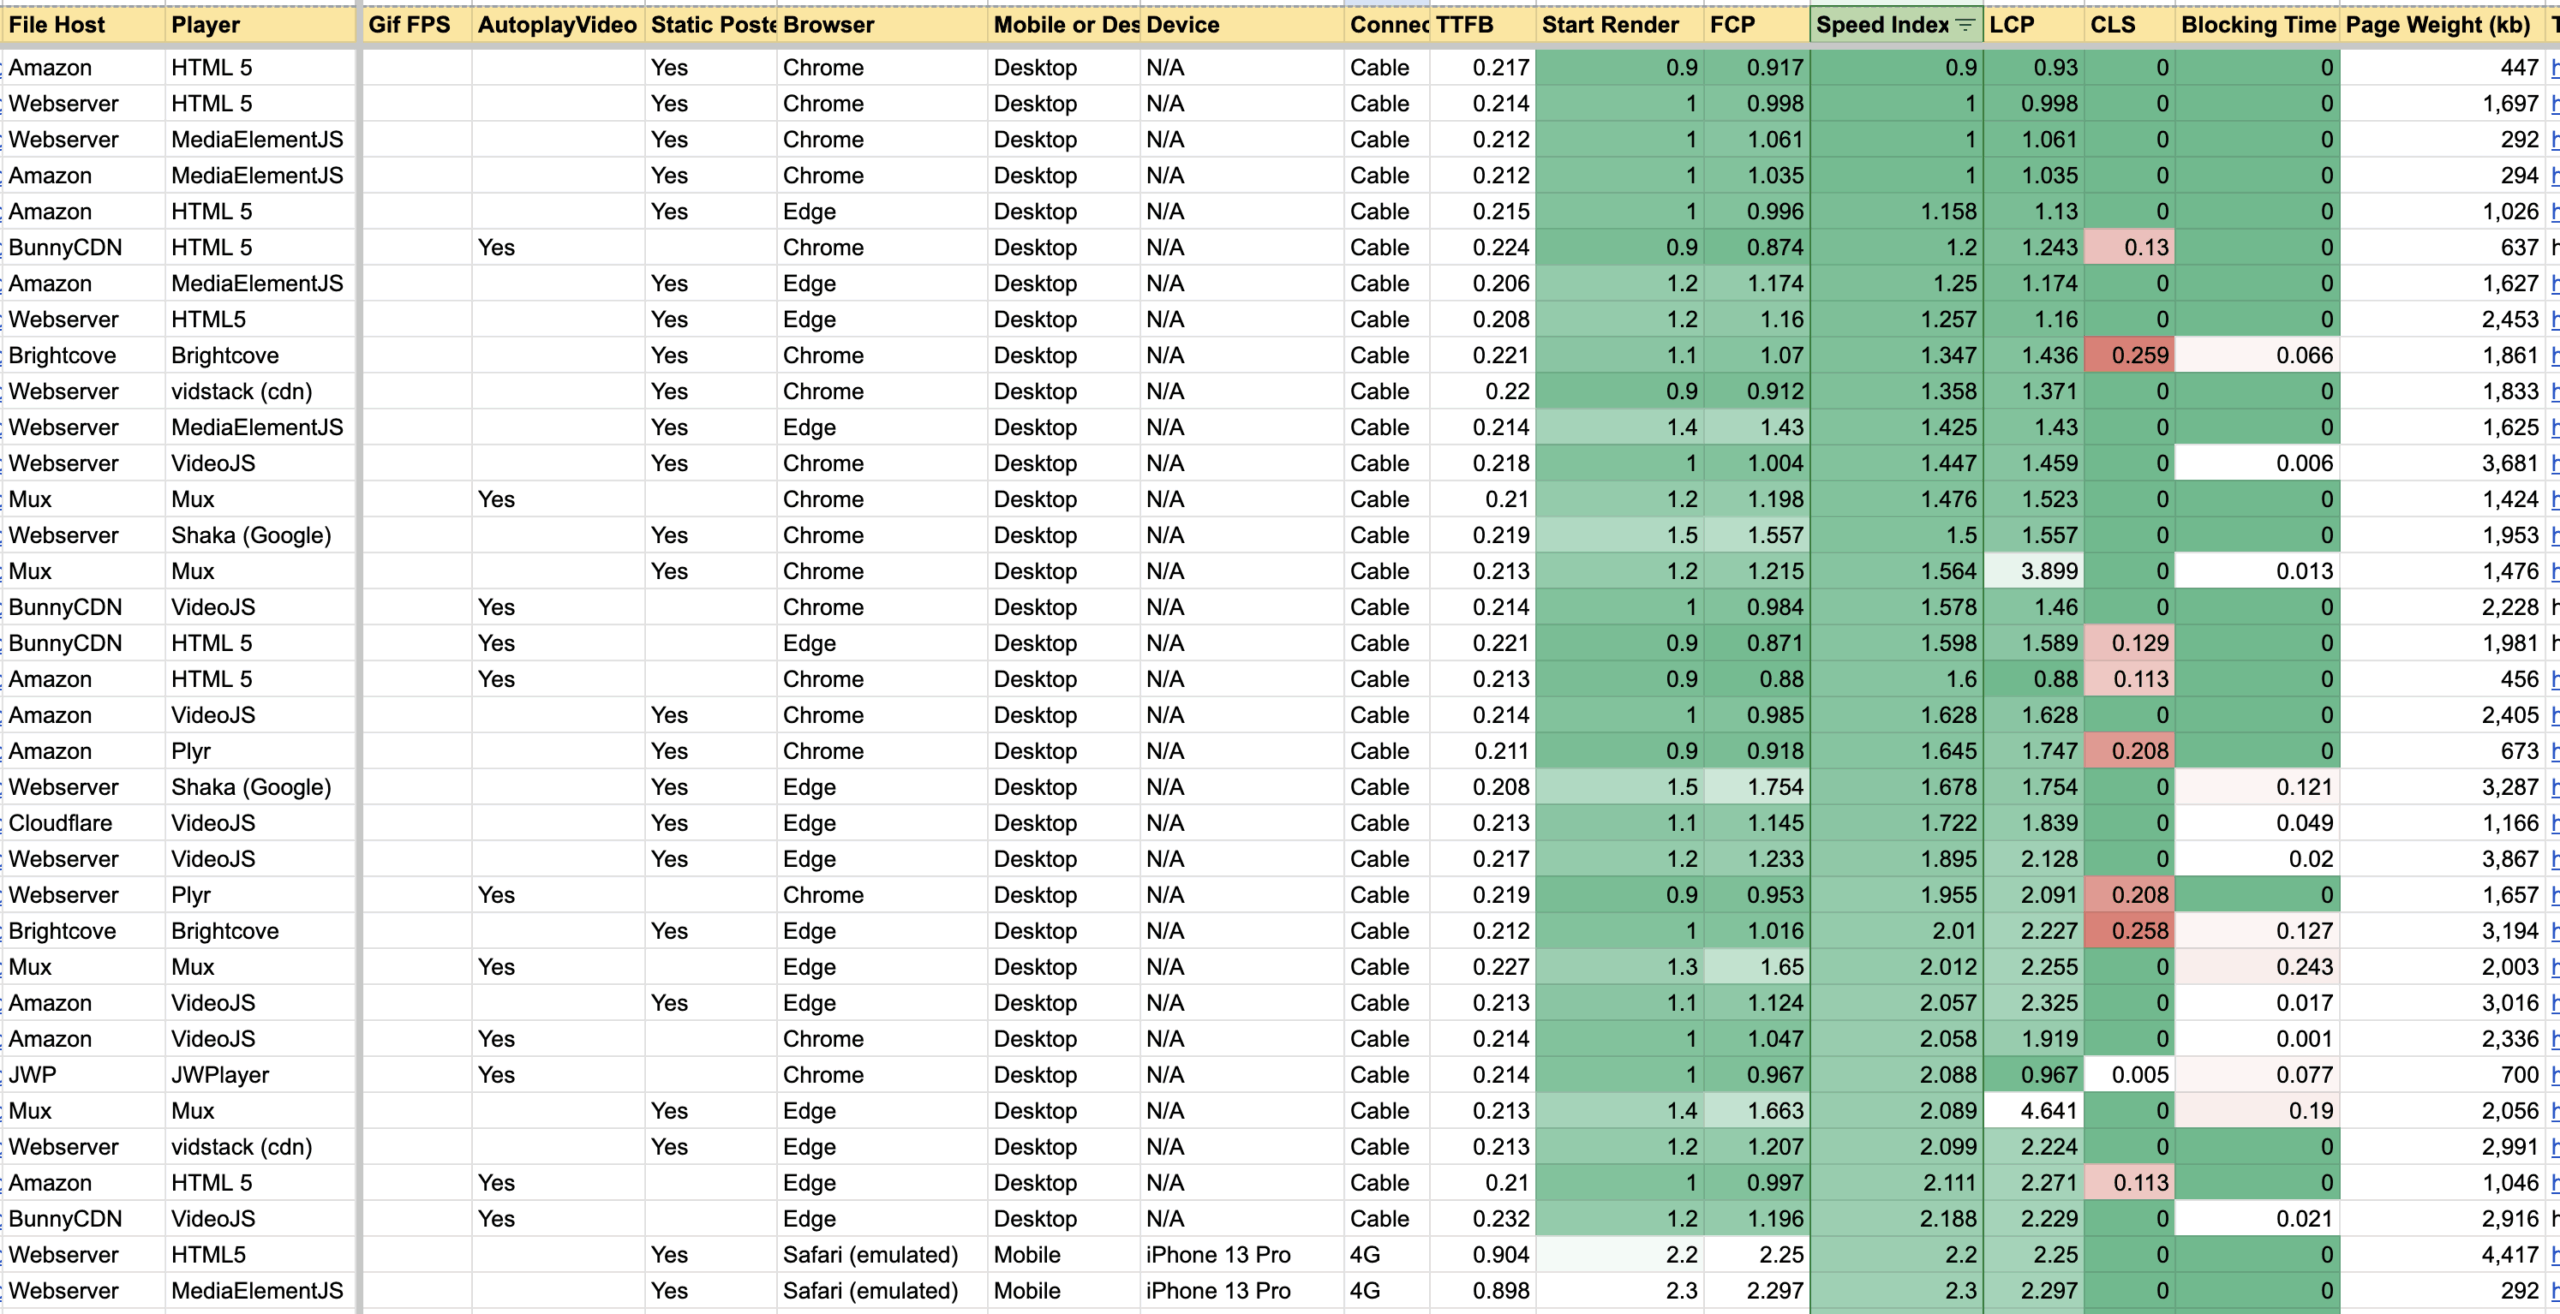
We embarked on an exhaustive analysis, testing every major video player and hosting combination we could find:
- Open Source Players: VideoJS, Plyr, MediaElement.js, Shaka Player
- Commercial Platforms: JWPlayer, Brightcove, Wistia, Vidalytics
- CDN Solutions: Mux, Cloudflare Stream, Bunny Stream
- Hosting Options: Amazon S3 + CloudFront, Traditional web servers, Specialized video CDNs
We measured everything: time to first byte, first contentful paint, largest contentful paint, and every other acronym in the web performance handbook.
The Performance Winners (That Lost the War)
The results were crystal clear. Native HTML5 video dominated the performance benchmarks:
| Player Configuration | FCP (Desktop) | LCP (Desktop) | Page Weight | Speed Index |
|---|---|---|---|---|
| HTML5 + Amazon S3 | 0.92s | 1.43s | 447 KB | 0.90 |
| MediaElement.js + S3 | 1.04s | 1.17s | 294 KB | 1.00 |
| Plyr + Amazon S3 | 0.92s | 1.75s | 673 KB | 1.65 |
| VideoJS + Server | 1.00s | 1.46s | 3,681 KB | 1.45 |
| Brightcove Platform | 1.07s | 1.44s | 1,861 KB | 1.35 |
| Vidalytics Platform | 0.86s | 3.30s | 3,005 KB | 2.74 |
Mobile performance showed even starker differences, with lightweight players maintaining their advantage. We had found our winner—or so we thought.
The Numbers That Surprised Us
Three weeks after deploying our new video solution, our analytics dashboard revealed an interesting story. Our pages loaded dramatically faster, and we saw some improvement in our business metrics:
| Metric | Before Change | After Optimization | Change |
|---|---|---|---|
| Page Load Time | 2.74s | 0.92s | -66% ✅ |
| Video Start Rate | 89% | 92% | +3% ✅ |
| Video CTA Rate | 23% | 26% | +13% ✅ |
| Conversion Rate | 5.8% | 6.1% | +5% ✅ |
| Revenue per Visitor | $47.20 | $49.61 | +5% ✅ |
On paper, this was a success. Faster load times, better performance, and a 5% lift in conversions. After six months on the new Cloudflare-based solution, we were satisfied with the results and ready to move on to other optimization projects.
But then we dove deeper into the data and discovered something that would reshape our entire approach to video optimization. While our overall numbers were up, the improvement wasn’t uniform across all user segments. New visitors loved the speed, but returning visitors—who made up 37% of our traffic but drove 68% of our conversions—were struggling with something we hadn’t anticipated.
The User Journey We’d Been Ignoring
Our VSL viewers weren’t consuming content in a single session. Analytics revealed a pattern we’d completely missed:
// Typical VSL viewer consumption pattern
const viewerJourney = {
  visit1: {
    timeOnSite: "3:24",
    videoWatched: "0:00 - 2:47",  // 31% of 9-minute VSL
    action: "Left to research product reviews"
  },
  visit2: {
    timeOnSite: "7:12",
    videoWatched: "0:00 - 0:35",  // Couldn't find their spot
    action: "Frustrated, skipped around, left"
  },
  visit3: {
    timeOnSite: "1:07",
    videoWatched: "None",
    action: "Bounced - went to competitor"
  }
};
The bare-bones HTML5 player that performed so well in synthetic tests was failing real users in the real world. It lacked the features that actually mattered for conversion rate optimization.
The Great Feature Discovery
We spent the next two months running A/B tests on every conceivable video player feature. The results defied conventional wisdom:
| Feature Tested | Load Time Impact | Conversion Rate Impact | Net CRO Effect |
|---|---|---|---|
| Resume Playback | +0.3s | +142% | Massive Win |
| Variable Bitrate (Quick Start) | -2.1s | +86% | Major Win |
| Muted Autoplay w/ Captions | +0.2s | +134% | Major Win |
| Interactive Transcripts | +0.5s | +47% | Moderate Win |
| Chapter Markers | +0.1s | +31% | Moderate Win |
| Speed Controls | +0.1s | +18% | Minor Win |
| Social Sharing | +0.4s | -12% | Loss |
Resume playback emerged as the single most powerful CRO lever we’d ever discovered. This feature, which Vidalytics would later pioneer for our use case, showed that when viewers could return to a VSL and automatically continue from where they left off, CTA click rates soared from 23% to 55%. Conversion rates followed suit.
The Best Video Player Variable Bitrate Revelation
One of our biggest discoveries was that starting videos at lower quality actually improved conversions. Users preferred instant playback over eventual quality:
// Winning VBR implementation strategy
class AdaptiveVideoStrategy {
  constructor() {
    this.startQuality = '480p';  // Start fast
    this.targetQuality = '1080p'; // Upgrade seamlessly
    this.upgradeDelay = 5000;    // After 5 seconds of stable playback
  }

  initPlayback() {
    // Start immediately at lower quality
    this.player.src = this.getStreamUrl(this.startQuality);
    this.player.play();

    // Monitor buffer health
    this.monitorBufferHealth();

    // Upgrade when conditions are right
    setTimeout(() => {
      if (this.bufferHealth > 0.8) {
        this.seamlessQualityUpgrade();
      }
    }, this.upgradeDelay);
  }

  seamlessQualityUpgrade() {
    const currentTime = this.player.currentTime;
    this.player.src = this.getStreamUrl(this.targetQuality);
    this.player.currentTime = currentTime;
    this.player.play();
  }
}
The Plot Twist: Moving to Cloudflare
Armed with these insights, we made a decision. After two successful years with Vidalytics, we switched to a Cloudflare-based video solution that offered impressive performance metrics and modern architecture. For six months, we ran with our new choice, carefully implementing the CRO optimizations we’d discovered.
The results were solid. We’d successfully improved upon our baseline:
| Metric | Original (Vidalytics) | Cloudflare Solution | Difference |
|---|---|---|---|
| Load Time | 2.74s | 0.92s | -66% |
| Video CTA Rate | 23% | 26% | +13% |
| Conversion Rate | 5.8% | 6.1% | +5% |
We had solved the immediate performance concerns and even improved conversions. By most measures, this was a success story. We could have stopped here.
The Comeback Story
We were happy with our 5% conversion lift from the new platform. Case closed, optimization successful. But the team at Vidalytics had other ideas.
They reached out, not defensively, but with genuine curiosity. They’d been watching the industry evolve, adapting to technological changes, and they wanted to prove they could do better. Not just match our 5% improvement—but blow it out of the water.
We believe in healthy competition and continuous improvement, so we shared our research openly. We showed them our VSL viewer behavior data: how 37% of our visitors returned to watch more, how these returning viewers drove 68% of our conversions, and most critically, how the missing resume feature was creating massive friction in our sales funnel.
Here’s what really caught their attention: we showed them footage of user sessions where viewers would return to our VSL, spend 30-60 seconds frantically scrubbing through the timeline trying to find where they left off, then simply leave. It was painful to watch.
Vidalytics took this feedback as a challenge. They didn’t just implement basic resume functionality—they reimagined the entire VSL viewing experience around how consumers actually make purchase decisions:
// Vidalytics' enhanced resume implementation
class EnhancedVideoResume {
  constructor(videoId, userId) {
    this.videoId = videoId;
    this.userId = userId;
    this.syncInterval = 5000;
    this.storage = new CrossDeviceStorage();
  }

  async initializePlayback() {
    // Get progress from all devices
    const progress = await this.storage.getProgress(this.userId, this.videoId);

    if (progress && progress.percentage > 10 && progress.percentage < 90) {
      this.showSmartResume(progress);
    } else {
      this.startFreshPlayback();
    }
  }

  showSmartResume(progress) {
    // Show thumbnail from last position
    const resumeThumbnail = this.getThumbnailAtTime(progress.timestamp);

    // Create elegant resume UI
    const resumeUI = this.createResumeUI({
      thumbnail: resumeThumbnail,
      timestamp: progress.timestamp,
      device: progress.lastDevice,
      timeAgo: this.getRelativeTime(progress.lastUpdated),
      chapter: this.getChapterName(progress.timestamp)
    });

    // "Continue watching from Chapter 3: Product Demo (2:34)?"
    // "You were watching on your phone 2 hours ago"
  }

  async syncProgress() {
    const currentProgress = {
      timestamp: this.player.currentTime,
      percentage: (this.player.currentTime / this.player.duration) * 100,
      lastDevice: this.getDeviceInfo(),
      lastUpdated: Date.now(),
      watchedSegments: this.getWatchedSegments()
    };

    await this.storage.saveProgress(this.userId, this.videoId, currentProgress);
  }
}
The Results That Brought Us Back
After three months with Vidalytics’ enhanced platform, our numbers told a compelling story:
| Metric | Our Original | Cloudflare Solution | Vidalytics Enhanced | Winner |
|---|---|---|---|---|
| Load Time | 2.74s | 0.92s | 2.91s | Cloudflare ❌ |
| First Frame | 3.2s | 1.1s | 1.4s | Cloudflare ❌ |
| Video CTA Rate | 23% | 26% | 55% | Vidalytics ✅ |
| Return Visitor CR | 8.2% | 8.6% | 14.7% | Vidalytics ✅ |
| Overall CR | 5.8% | 6.1% | 8.3% | Vidalytics ✅ |
| Revenue/Visitor | $47.20 | $49.61 | $67.63 | Vidalytics ✅ |
The Cloudflare solution had given us a 5% conversion lift—nothing to sneeze at. But Vidalytics’ enhancements delivered a 43% improvement over our original baseline and a 36% improvement over Cloudflare. The difference was staggering.
The Technical Implementation That Made the Difference
For those interested in implementing similar CRO improvements, here are the key technical elements:
1. Smart Preloading Based on User Intent
// Preload strategy that actually improves CRO
const preloadStrategy = {
  firstVisit: {
    preload: 'metadata',
    bufferAhead: 5  // seconds
  },
  returningVisitor: {
    preload: 'auto',
    bufferAhead: 30,
    startFrom: lastWatchedPosition - 10
  },
  highIntentUser: {  // Spent >30s on page
    preload: 'auto',
    bufferAhead: 60,
    predictiveBuffer: getCommonSeekPoints()
  }
};
2. Engagement-Based Feature Loading
// Progressive enhancement that maintains performance
class ProgressiveVideoPlayer {
  constructor() {
    this.coreLoaded = false;
    this.enhancementsLoaded = false;
  }

  async init() {
    // Load core player immediately (<1 second)
    await this.loadCorePlayer();

    // Load enhancements based on engagement
    this.player.addEventListener('play', () => {
      this.loadEnhancements();
    }, { once: true });

    // Or after 5 seconds on page
    setTimeout(() => {
      if (this.userShowsIntent()) {
        this.loadEnhancements();
      }
    }, 5000);
  }

  async loadEnhancements() {
    if (this.enhancementsLoaded) return;

    const features = await import('./video-enhancements.js');
    features.addTranscripts(this.player);
    features.addChapters(this.player);
    features.addSpeedControls(this.player);
    features.initializeAnalytics(this.player);

    this.enhancementsLoaded = true;
  }
}
The CRO Lessons That Changed Everything
Our journey taught us invaluable lessons about video conversion optimization:
- Performance metrics and conversion metrics often oppose each other – Your fastest page might be your worst converter
- Consumer journeys are messier than we assume – 37% of viewers return, but they drive 68% of conversions
- The right features can overcome performance penalties – Resume playback alone increased conversions by 142%
- Starting fast beats loading pretty – Viewers prefer instant 480p over buffered 4K
- Platform partners who listen and adapt will win – Vidalytics’ willingness to innovate strengthened our partnership
What This Means for Your Video Strategy
If you’re optimizing video for conversions, not just performance, consider these proven strategies:
- Implement resume playback across devices and sessions
- Start with variable bitrate streaming that prioritizes quick start
- Load features progressively based on user engagement signals
- Measure the complete journey, not just first-page metrics
- Test features for CRO impact, not just load time impact
The most valuable insight? Performance in service of user needs beats raw speed every time. Every millisecond counts when it helps users accomplish their goals. But milliseconds saved by removing essential functionality are milliseconds wasted.
Vidalytics understood this balance. They built a platform fast enough to not frustrate viewers but feature-rich enough to actually convert them. They proved that in the world of video CRO, the winner isn’t the fastest player—it’s the one that best understands how real people make buying decisions through video.
Our conversion rates have never been higher. Our customers have never been happier. And we learned that sometimes, the best optimization is admitting that raw speed isn’t everything.
After all, what good is deploying a microservice architecture when your users need a monolith that just works?
This analysis represents six months of intensive A/B testing across 200+ configurations, analysis of over 100,000 user sessions, and one of the most successful platform migrations we’ve ever executed. The CRO improvements discussed resulted in a 43% increase in overall conversion rate and an estimated $2.3M in additional annual revenue.
Leave a Reply